The visualisation module of Praaline is based on Sonic Visualiser (Cannam, 2010). Visualisations can display waveforms, spectrograms, melodic spectrograms, any combination of annotation levels and tiers, numerical data (points, curves, histograms, colour-coded regions etc.). Plug-ins may add visualisations: for example, we have adapted Prosogram (Mertens, 2004) do display prosodic analysis information. These elements can be combined to present annotations in a format appropriate for each type of investigation. For example, a dialogue involving multiple speakers can be visualised in speaker turns.
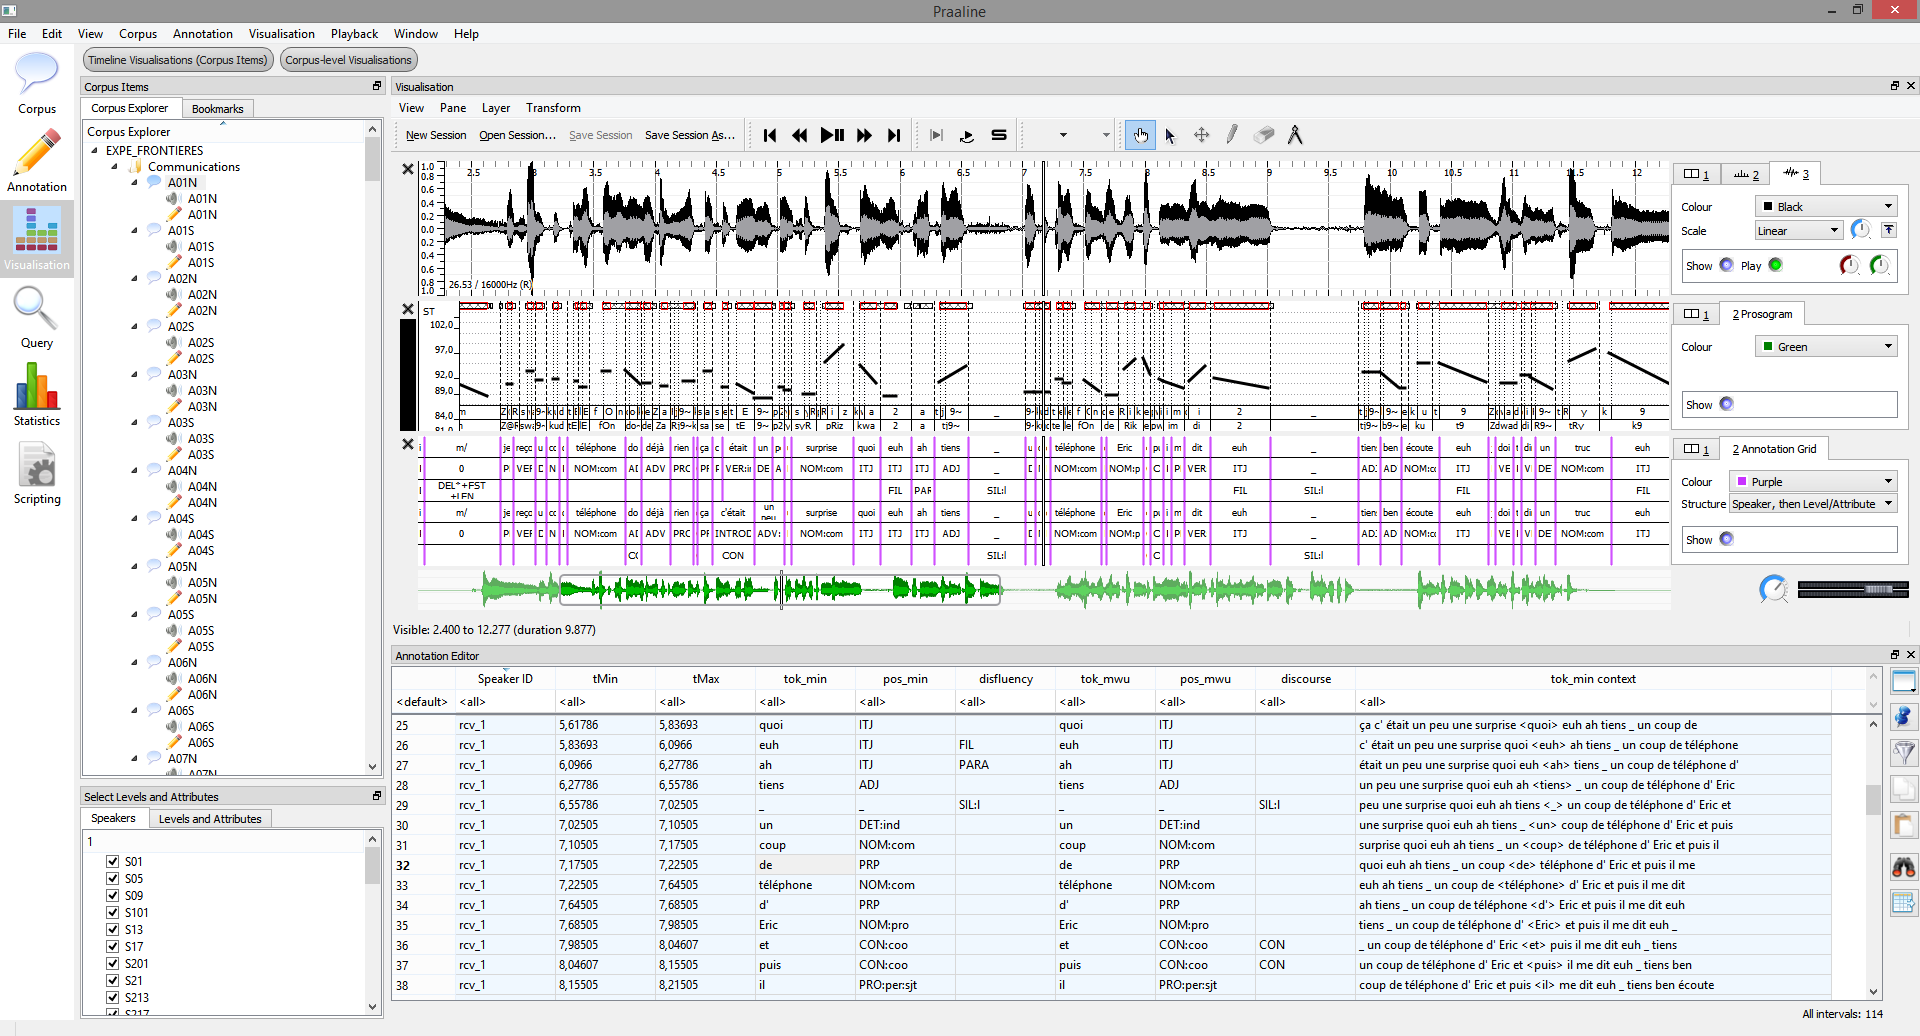
In the screenshot above, a data visualisation is displayed simultaneously with a tabular annotation editor. The visualisation shows the waveform, the corresponding Prosogram, and multiple annotations: the phones level, the syllable level, the minimal token level with the corresponding part-of-speech annotation, and the multi-word unit level. The annotation editor and the visualisation remain synchronised; the user may start playing the sound and annotate at the same time.
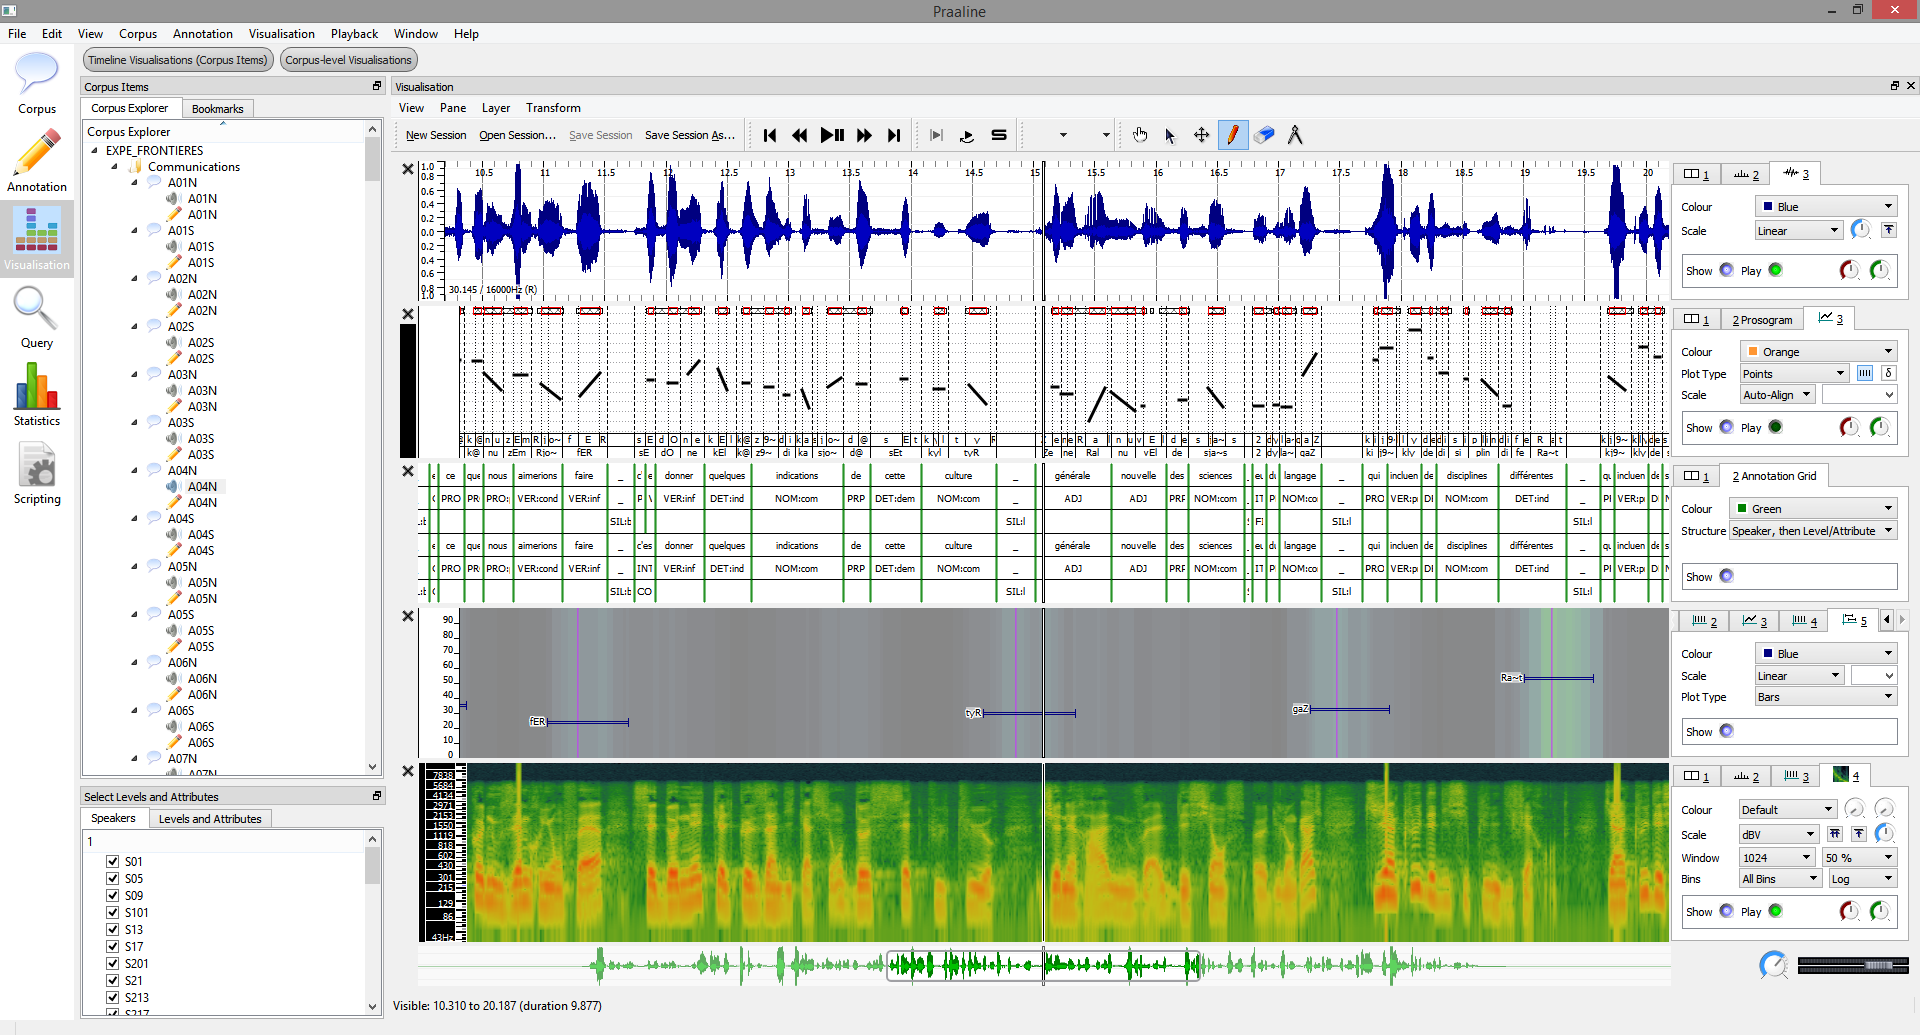
By combining Panes and Layers, the user may create simple or complex visualisations, corresponding to the research question at hand and the level of detail required. In the following screenshot, the visualisation combines a waveform, a spectrogram, a Prosogram, a pane displaying annotation levels (the DisMo annotation) and a pane with two layers: a colour-coded segments layer and a time regions layer.